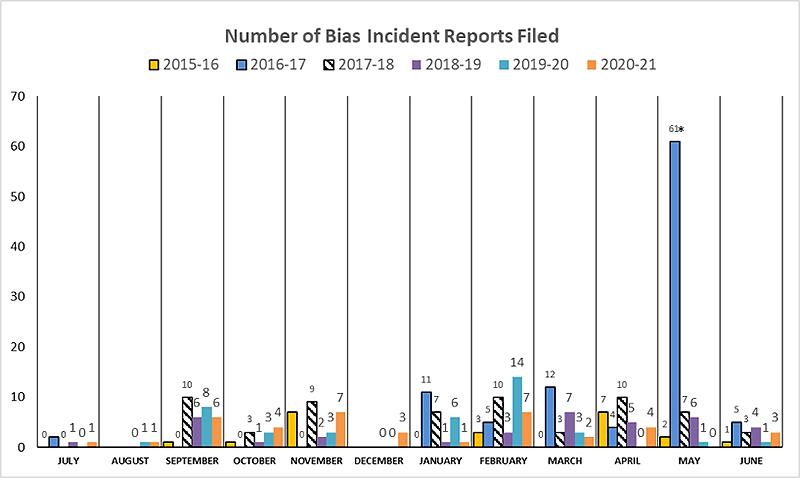
This graph shows trends by month in bias incident reports filed during the following academic years, with totals listed here:
- 2015-2016: 22
- 2016-2017: 100
- 2017-2018: 62
- 2018-2019: 36
- 2019-2020: 40
- 2020-2021: 36

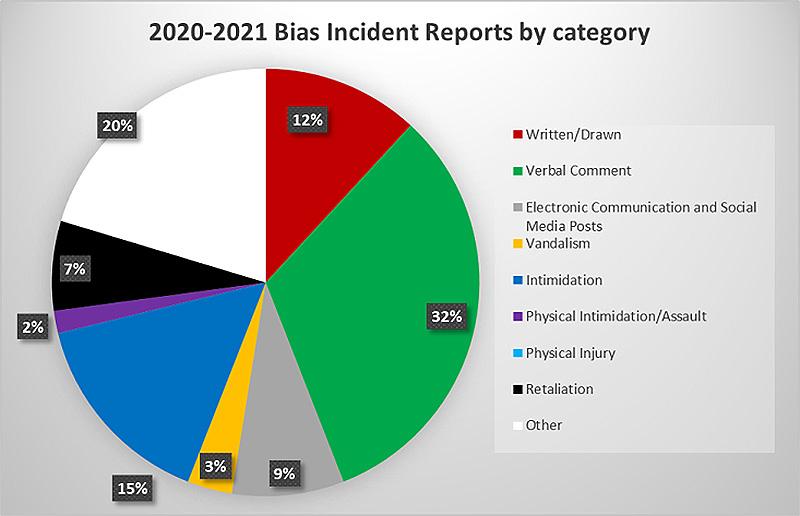
Our Bias Incident Report form allows individuals to select the type of incident. Some incidents meet more than one standard. We collect data by category and use these categories to help identify patterns. In 2020-2021, verbal comments were the most frequent form that bias incidents took, followed by written or drawn materials.

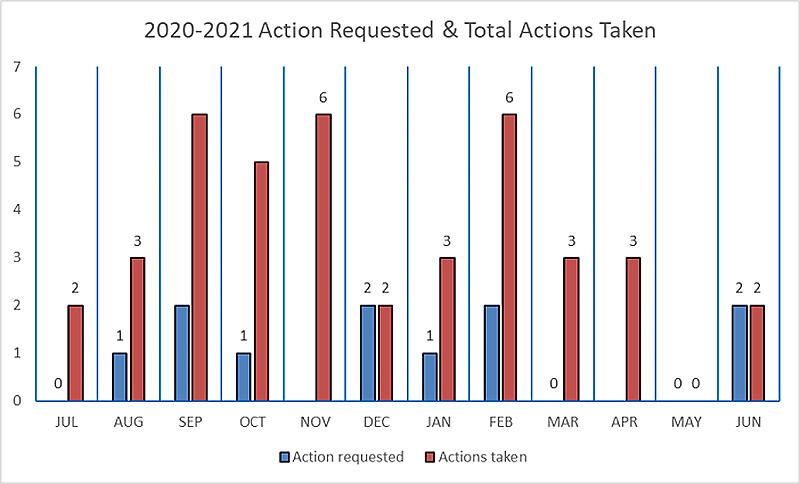
Each year, we track the number of requests for action versus the number of actions taken in order to assess our strength in providing the supportive services that individuals impacted by bias incidents receive. This graph shows actions requested and taken during the 2020-2021 academic year.
Actions taken fall into three categories. One way the office intervened was to meet with individuals making a report to discuss options for responding to the incident. Another was to have an educational meeting(s) with the person said to have engaged in biased behavior. Finally, the Vice President for Diversity, Equity, and Inclusion when appropriate forwards the incident to other administrative offices for their information, adjudication, or investigation. This could also include referral to Campus Safety and the Appleton Police Department.